Asesorías contables y tecnológicas efectivas

Ofrecemos soluciones contables, dashboards e informes personalizados para tu negocio.

Asesoría Contable

Soluciones contables adaptadas a tus necesidades específicas.

Informes claros y precisos para tu negocio.

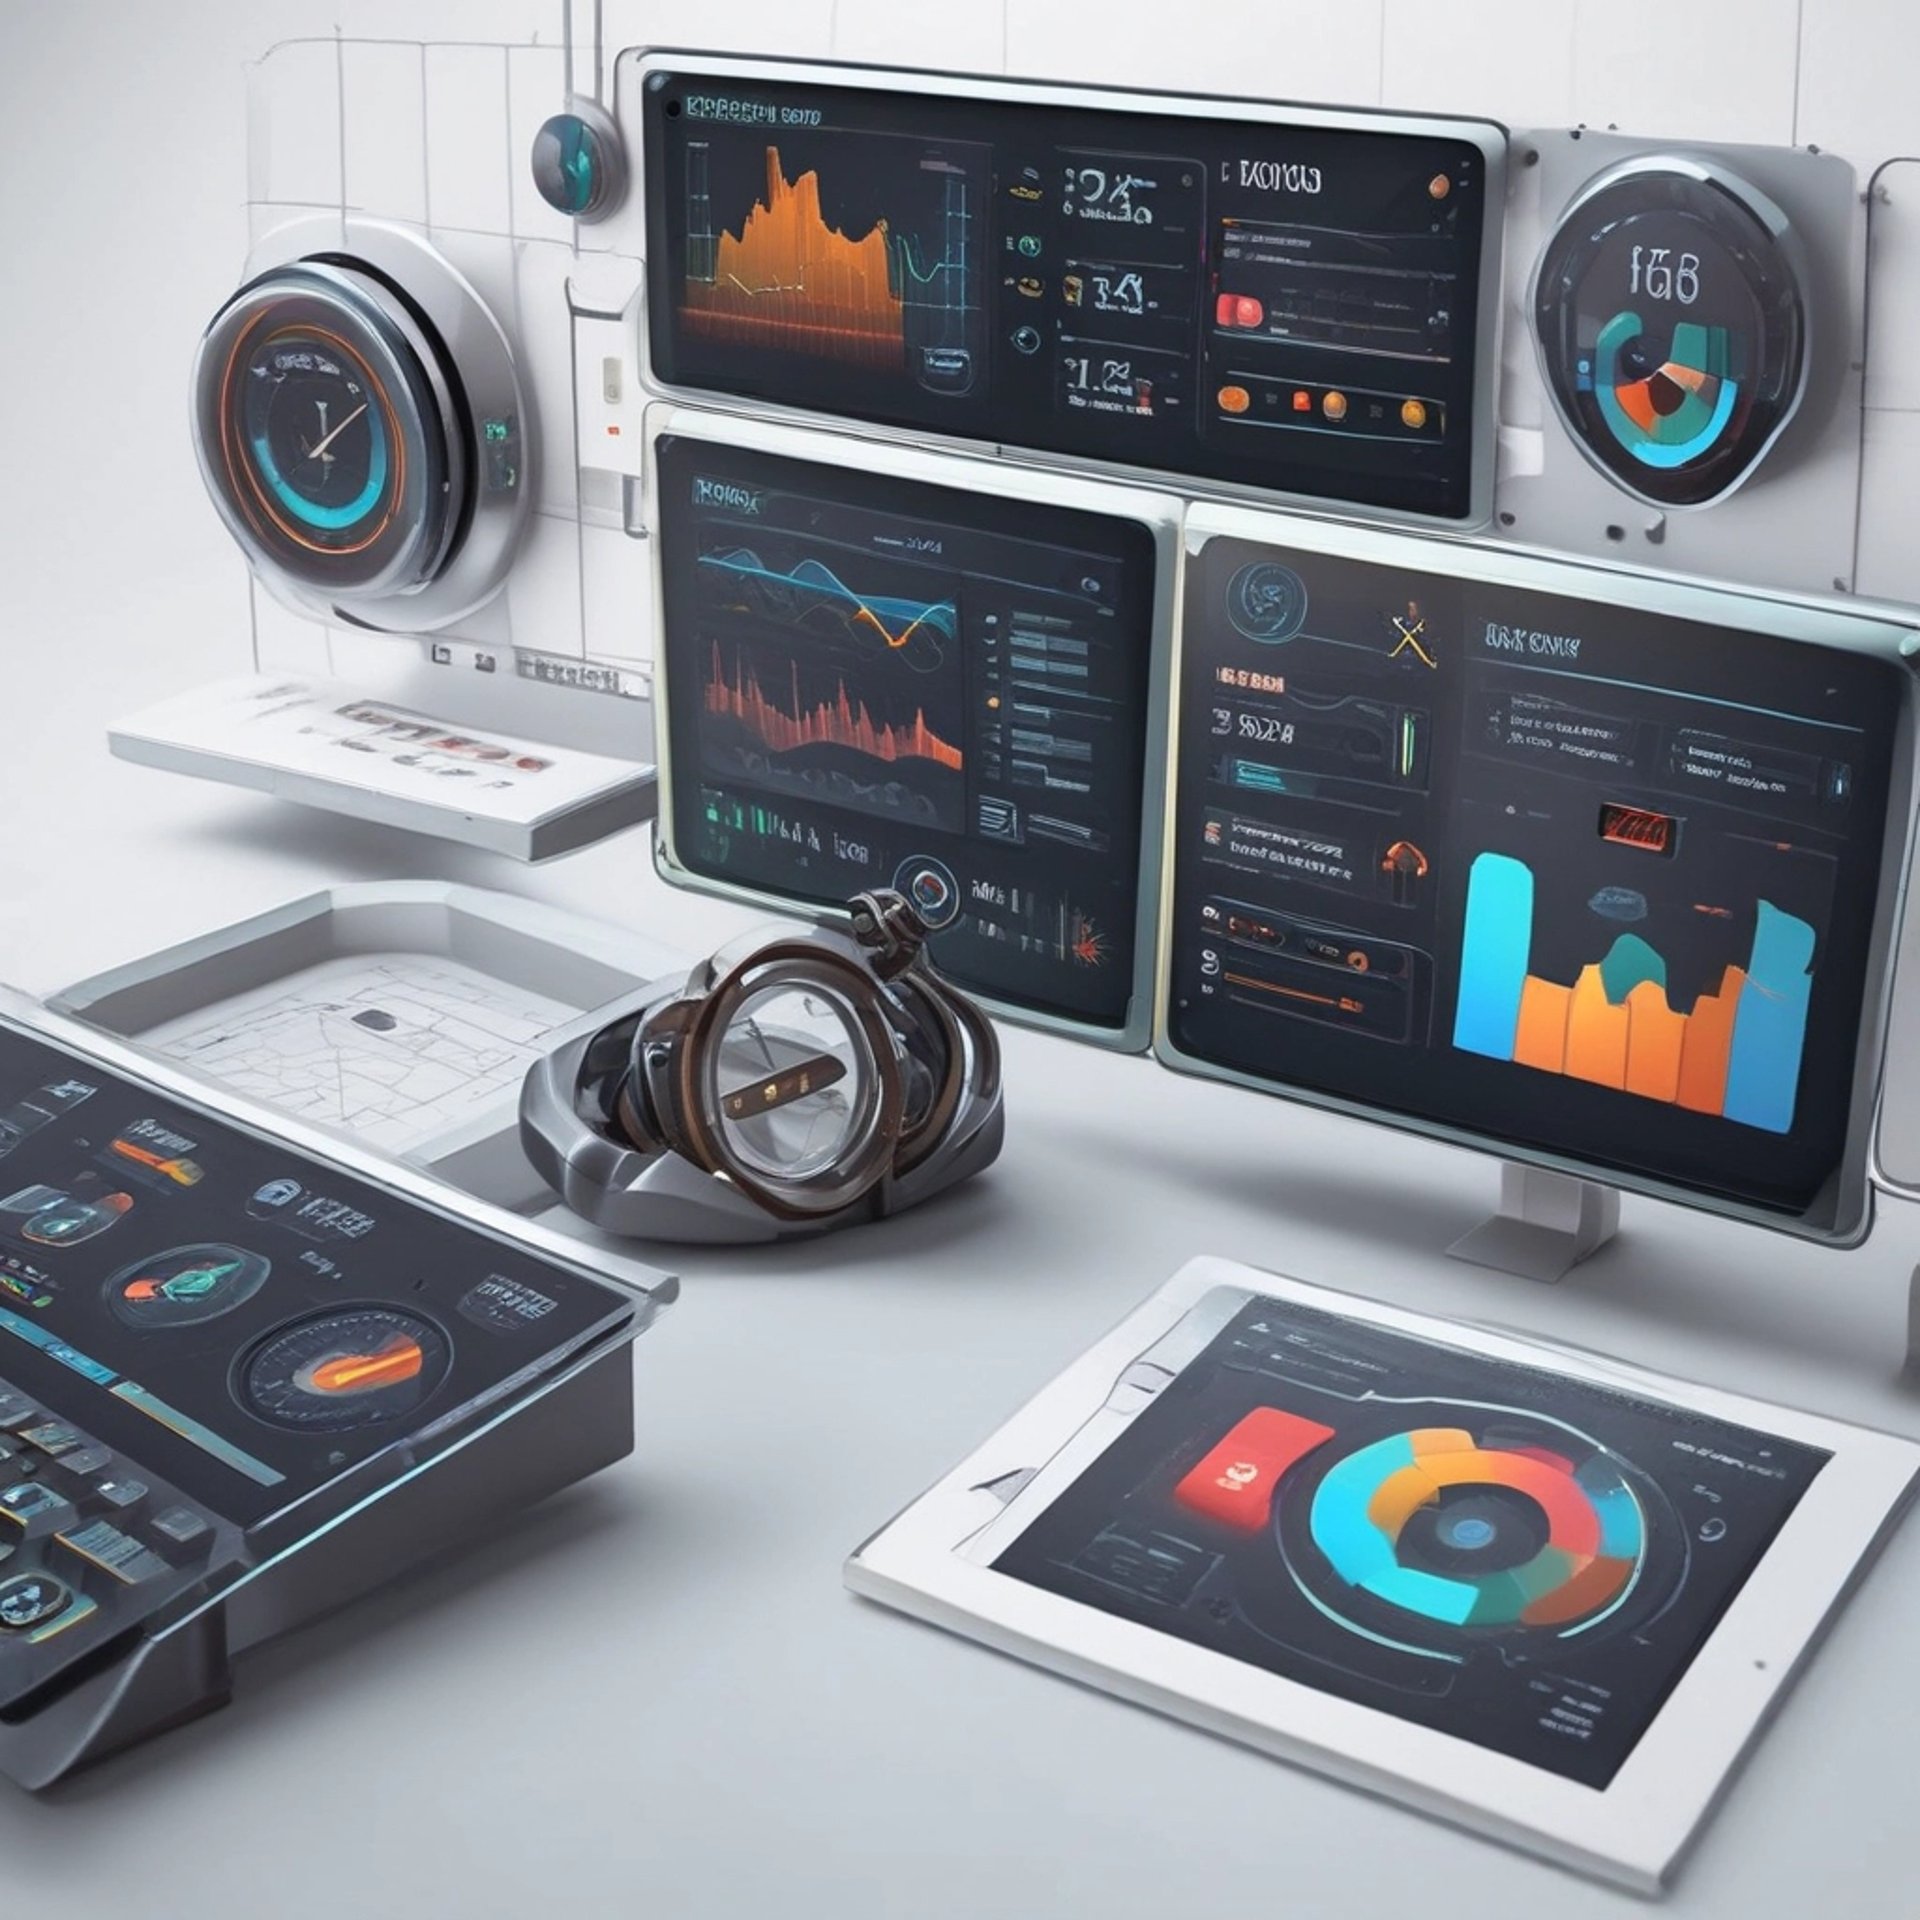
Dashboards que facilitan la toma de decisiones.

Consultoría Técnica
Soporte para SIGO y DIAN.

Asesoría contable y tecnológica integral

En Dynamic Growth ofrecemos asesorías contables, dashboards e informes personalizados. Nuestro equipo experto está listo para ayudarte a optimizar tus procesos y cumplir con las normativas de la DIAN.

A digital dashboard displaying various analytics charts and graphs. There is a line graph showing user engagement over time on the left, a section with total revenue marked as $74K, and bar charts illustrating user statistics by region. The central section highlights users in the last 30 minutes, focusing on different countries such as the United States, Canada, India, Pakistan, and Brazil.
Tu aliado en contabilidad
Innovación en servicios contables

Con nuestra tecnología avanzada, facilitamos la gestión contable y te proporcionamos informes claros y precisos. En Dynamic Growth, tu éxito es nuestra prioridad y estamos aquí para apoyarte.

Servicios Contables Avanzados

Ofrecemos asesorías contables, dashboards y elaboración de informes para optimizar tu gestión empresarial.

Asesoría Contable

Brindamos asesorías personalizadas para resolver tus dudas contables y mejorar tu administración financiera.

A computer screen displaying a data analytics dashboard with graphs and charts. A blue line graph shows fluctuations in data over time, and a section highlights the number of page views. A pie chart is partially visible, indicating a breakdown of different data elements.
Dashboards Interactivos

Creamos dashboards que te permiten visualizar la información financiera de tu negocio de manera efectiva.

Informes Detallados

Generamos informes contables que facilitan la toma de decisiones y el cumplimiento con la DIAN.
A laptop with an open screen displaying dashboard analytics featuring charts, graphs, and numerical data related to sales and subscriptions. The interface is predominantly dark-themed with sections highlighting key performance metrics. The device shown is a MacBook Pro, indicated by the keyboard layout and branding.
A computer screen displaying analytics dashboards with various charts, including a line graph on the left and a cohort analysis table on the right. The table is populated with different shades of blue, indicating varying levels of user activity over several weeks. Text labels and numbers detail user retention statistics.

Contáctanos para asesoría

Estamos aquí para ayudarte con tus necesidades contables y tecnológicas. Contáctanos para más información sobre nuestros servicios y soluciones personalizadas.

Asesoría

1234567890

Soporte

contacto@dynamicgrowth.com

Las asesorías contables de Dynamic Growth han transformado nuestra gestión financiera. ¡Altamente recomendados!

Juan Pérez

A laptop displaying a dashboard with various graphs, charts, and numeric data. The screen is partially visible, showcasing sections with line graphs, financial figures, and small images. The background is blurred with a prominent red light creating a warm ambiance.
A financial report is laid out with an intricate chart showing data trends over multiple years. Surrounding text appears to be in a newspaper format, with graphs and tables prominently displayed. The focus is on a detailed line graph illustrating fluctuations.

★★★★★